We have had great success helping our region and beyond with implementing the ADA. Below is a visual infographic of Technical Assistance (TA) data and usage for October 1, 2016 - September 30, 2021.
Below the images is a screen-reader-friendly version describing the visual infographics. The infographic and accessible version are available for download as well.
CONTENTS
How data is described in this document
How did people find T A Requests?.
How did people communicate with the Rocky Mountain A D A Center regarding T A requests?
Activities Involving Standardized Topics.
T A Activities Involving Standardized
A D A Print Materials Disseminated.
Images
About This Document
An infographic with graphs and pie charts was created to showcase the important data. This document is an accessible description of the data and charts for screen readers.
How Data is described in this document
The infographic contains either pie charts or bar charts. Ordered lists will be used from highest to lowest numbers or percentages.
For tables, the title will be given, followed by the percentage and the number. Percentages are rounded to the nearest whole number in most cases.
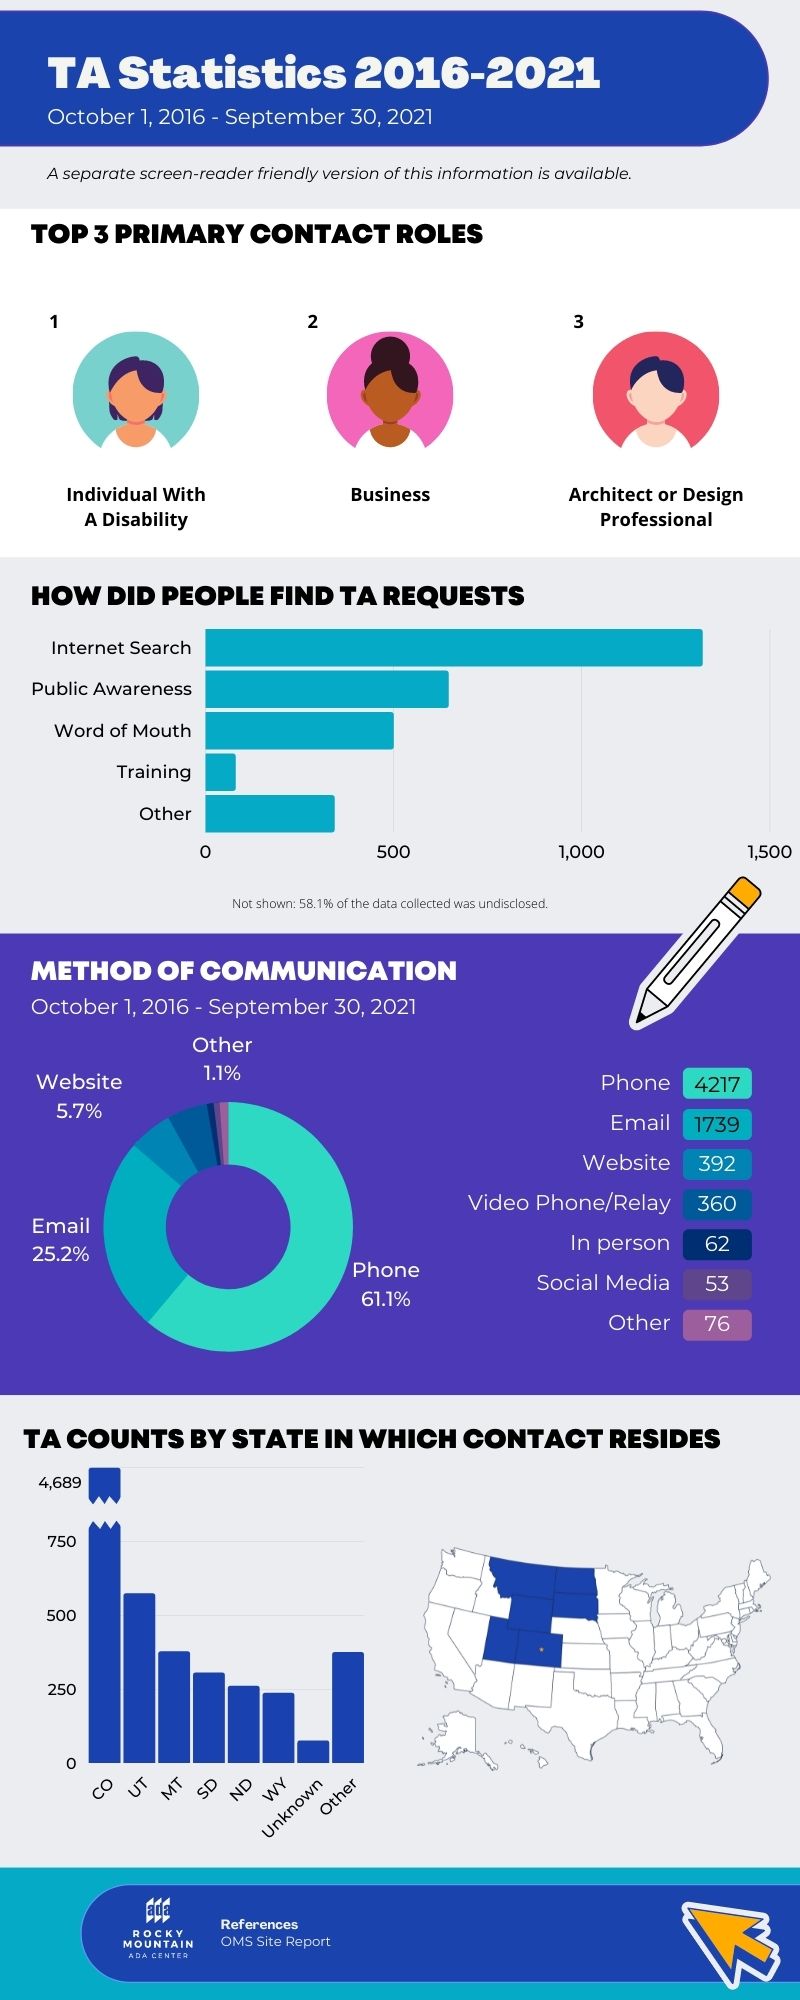
Top 3 Primary Contact Roles
Most people who requested technical assistance fell into the following three roles:
- An individual with a disability.
- Businesses or business owners.
- Architects or design professionals.
How did people find T A Requests?
58.1% of the data collected was unknown or undisclosed. Of what was disclosed, people found T A requests through:
| Source | Percentage | Number |
|---|---|---|
| Search | 46% | 1321 |
| Public Awareness | 22% | 646 |
| Word Of Mouth | 17% | 500 |
| Training | 3% | 80 |
| Other Sources | 12% | 343 |
How did people communicate with the Rocky Mountain A D A Center regarding T A requests?
This is displayed as a pie chart.
| Source | Percentage | Number |
|---|---|---|
| Phone | 61% | 4217 |
| 25% | 1739 | |
| Website | 6% | 392 |
| Video phone | 5% | 360 |
| In person | 1% | 62 |
| Social Media | 1% | 53 |
| Other methods | 1% | 76 |
T A Counts by State
Bar chart of state in which the contact resides. First 6 results are of the Rocky Mountain A D A Region, followed by other states.
| State | Percentage | Number |
|---|---|---|
| Colorado | 68% | 4689 |
| Utah | 8% | 575 |
| Montana | 5% | 378 |
| South Dakota | 4% | 306 |
| North Dakota | 4% | 261 |
| Wyoming | 3% | 238 |
| Other States | 5% | 376 |
| Unknown | 1% | 76 |
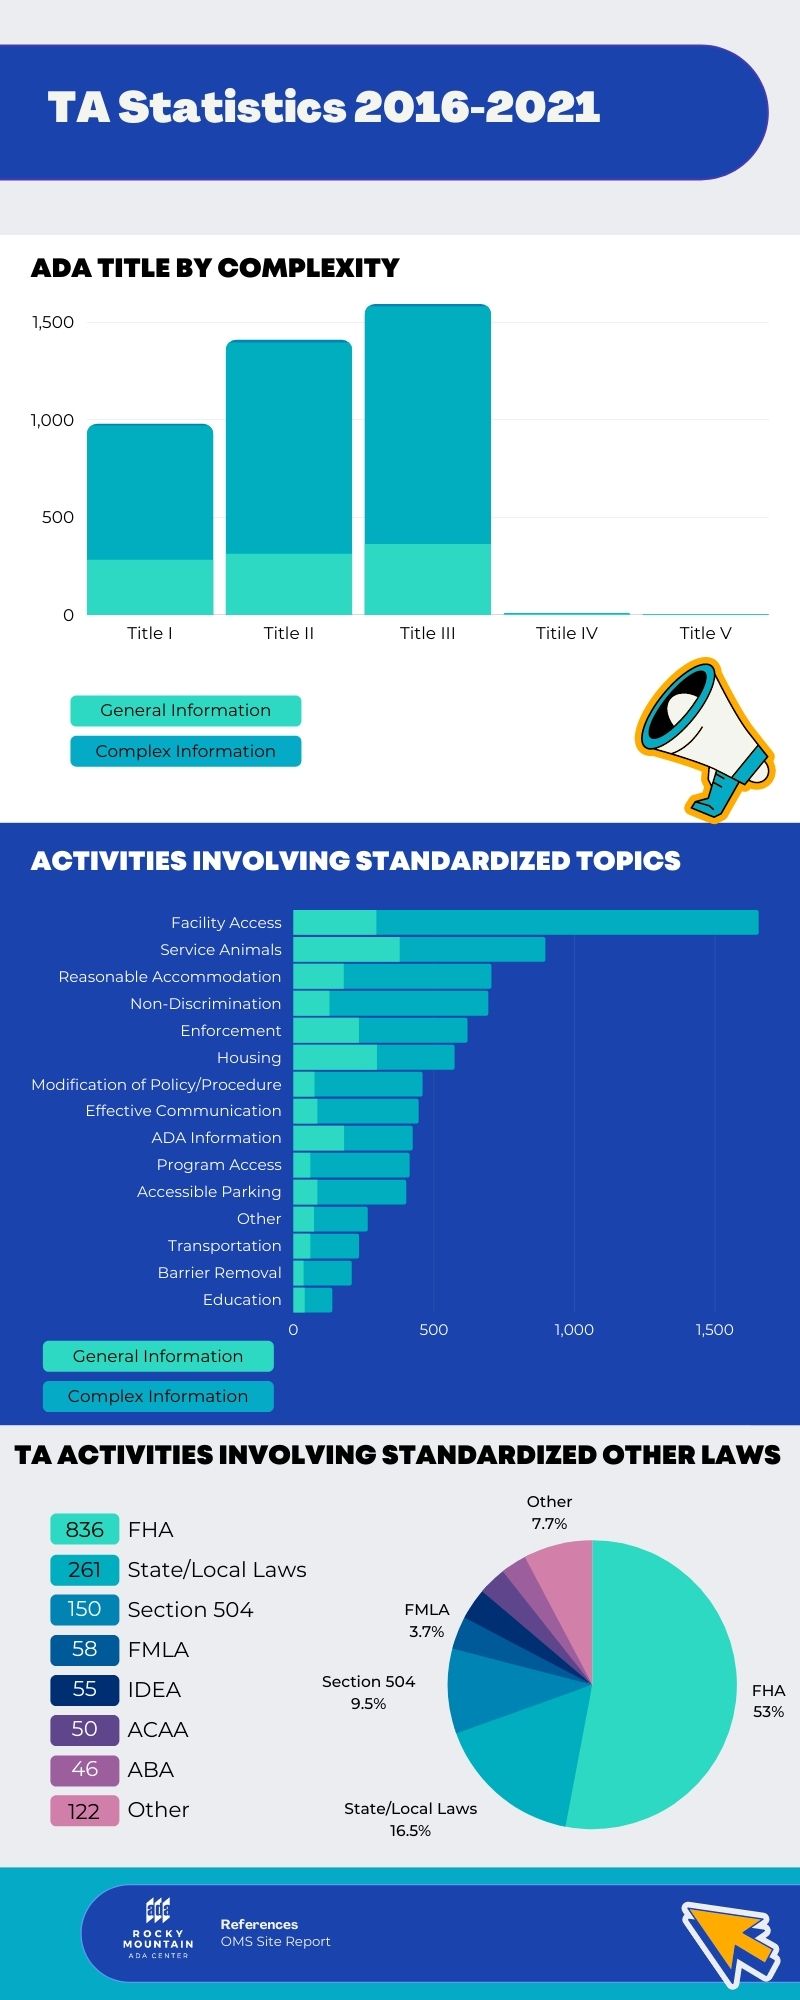
A D A Title by Complexity
T A requests were broken down for titles 1-5 as one of two options: General information and Complex information.
For each bar in the chart, about ¼ of each bar was requests for General Information, while the remaining ¾ of the bar was for Complex Information.
Requests for Titles 4 and 5 combined were less than 1% of all requests and barely display at all on the bar chart.
| Title | General Information | Complex Information | Total Requests | Percent |
|---|---|---|---|---|
| Title 1 | 282 | 689 | 971 | 17% |
| Title 2 | 314 | 1082 | 1396 | 27% |
| Title 3 | 363 | 1219 | 1582 | 31% |
| Title 4 | 5 | 4 | 9 | 0.1% |
| Title 5 | 3 | 0 | 3 | 0.0% |
Activities Involving Standardized A D A Topics
This was a bar chart. Facility Access was the most common activity by a large margin. Again, these requests were for General and Complex information.
| Activity | General Information | Complex Information | Total Requests | Percent |
|---|---|---|---|---|
| Facility Access | 295 | 1360 | 1655 | 17% |
| Service Animals | 378 | 518 | 896 | 6% |
| Reasonable Accommodation | 179 | 525 | 704 | 6% |
| Non-Discrimination | 128 | 565 | 693 | 7% |
| Enforcement | 233 | 386 | 619 | 5% |
| Housing | 297 | 276 | 573 | 3% |
| Modification of Policy/Procedure | 75 | 384 | 459 | 5% |
| Effective Communication | 85 | 360 | 445 | 4% |
| A D A Information | 180 | 244 | 424 | 3% |
| Program Access | 60 | 353 | 413 | 4% |
| Accessible Parking | 85 | 316 | 401 | 4% |
| All Other Activities | 73 | 191 | 264 | 2% |
| Transportation | 60 | 173 | 233 | 2% |
| Barrier Removal | 36 | 171 | 207 | 2% |
| Education | 40 | 98 | 138 | 2% |
T A Activities Involving Standardized Laws
A pie chart showing which law the request involved.
| Law | Percent | Number |
|---|---|---|
| FHA (Fair Housing Act) | 53% | 836 |
| State or Local Laws | 17% | 261 |
| Section 504 | 10% | 150 |
| FMLA (Family Medical Leave Act) | 4% | 58 |
| IDEA (Individuals with Disabilities Education Act) | 3% | 55 |
| ACAA (Air Carrier Access Act) | 3% | 50 |
| ABA (Architectural Barriers Act) | 3% | 46 |
| Other Laws | 8% | 122 |
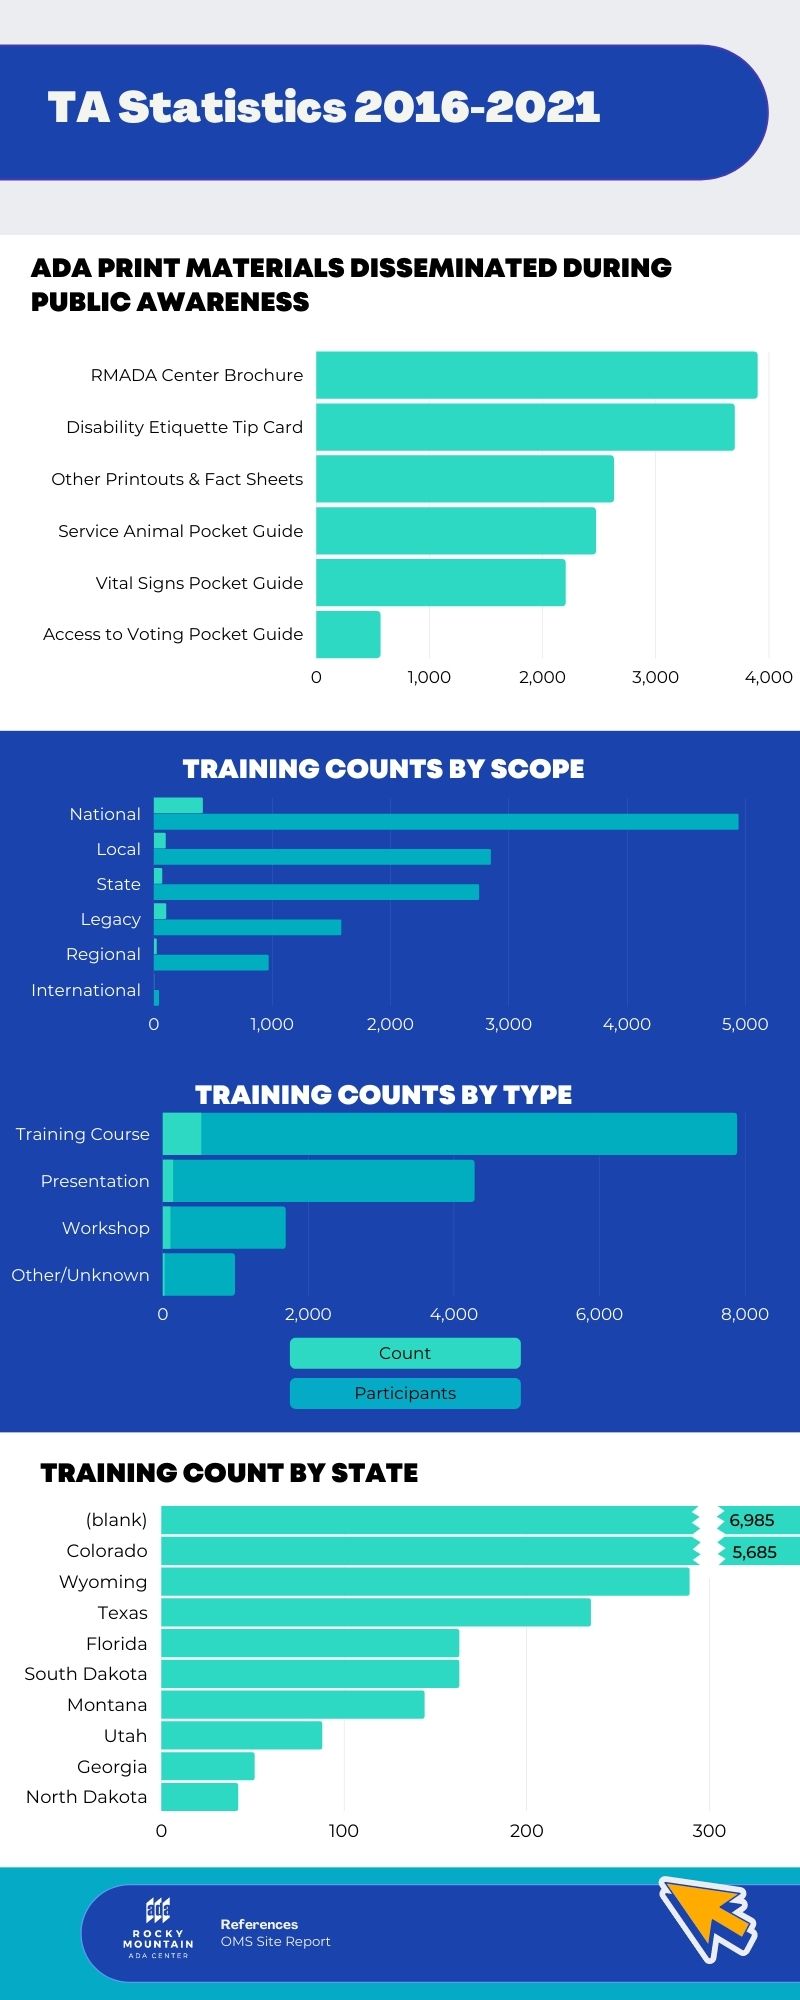
A D A Print Materials Disseminated
The Rocky Mountain A D A Center offers many helpful and informational print resources for businesses, government, and individuals.
| Print Material | Percent | Number |
|---|---|---|
| RMA D A Center Brochure | 25% | 3899 |
| Disability Etiquette Tip Card | 24% | 3697 |
| All Other Printouts & Fact Sheets | 17% | 2630 |
| Service Animal Pocket Guide | 16% | 2471 |
| Vital Signs Pocket Guide | 14% | 2203 |
| Access to Voting Pocket Guide | 4% | 567 |
Training Counts by Scope
Regional scope. Percentages are based on number of participants.
| Locale | Number of Trainings | Participant Count | Percent |
|---|---|---|---|
| National | 414 | 4941 | 38% |
| Local | 100 | 2847 | 22% |
| State | 70 | 2748 | 21% |
| Legacy | 104 | 1583 | 12% |
| Regional | 25 | 969 | 7% |
| International | 2 | 42 | 0% |
Training Counts by Type
Percentages based on participant count
| Training Type | Number of Trainings | Participant Count | Percent |
|---|---|---|---|
| Training Course | 528 | 7361 | 52% |
| Presentation | 141 | 4141 | 29% |
| Workshop | 104 | 1583 | 11% |
| Other/Unknown | 25 | 965 | 7% |
Training Counts by State
Not included was the data where the state was unknown or undisclosed, which was 50.5% of all data. This includes US States both within and outside of the Rocky Mountain A D A region.
| State | Percent | Number |
|---|---|---|
| Colorado | 82.9% | 5685 |
| Wyoming | 4.2% | 289 |
| Texas | 3.4% | 235 |
| Florida | 2.4% | 163 |
| South Dakota | 2.4% | 163 |
| Montana | 2.1% | 144 |
| Utah | 1.3% | 88 |
| Georgia | 0.7% | 51 |
| North Dakota | 0.6% | 42 |