Continuing the first part of this blog, in my observations and training of law enforcement officers, I believe that one the best ways to educate employees of Title II (State and Local Government Programs) and Title III (Private Businesses and Non-Profit organizations) about the abilities of individuals who are disabled is to hire individuals who are Deaf and/or disabled.
Such individuals do not need to be front-line employees, such as law enforcement officers. Although there are a number of law enforcement officers who are Deaf or hard of hearing themselves. One example is Dalhart Police Officer Erica Trevino, who is the first female deaf commissioned police officer in the state of Texas. Other states may have law enforcement officers and first responders who are Deaf or have a disability.
There are other positions within government programs, such as support service staff, that may be appropriate. Including these hires can create basic awareness of the abilities of persons with disabilities. The core rationale for hiring individuals with disabilities is Title I of the Americans with Disabilities Act (ADA). Title I prohibits discrimination on the basis of disability in all aspects of employment.
Title I of the ADA requires that Reasonable Accommodations be made to allow qualified individuals with disabilities who are employees or applicants for employment, unless to do so would cause undue hardship. The Equal Employment Opportunities Commission (EEOC) states that "in general, an accommodation is any change in the work environment or in the way things are customarily done that enables an individual with a disability to enjoy equal employment opportunities." The ADA Title I covers all employers with 15 or more employees, including State and local governments.
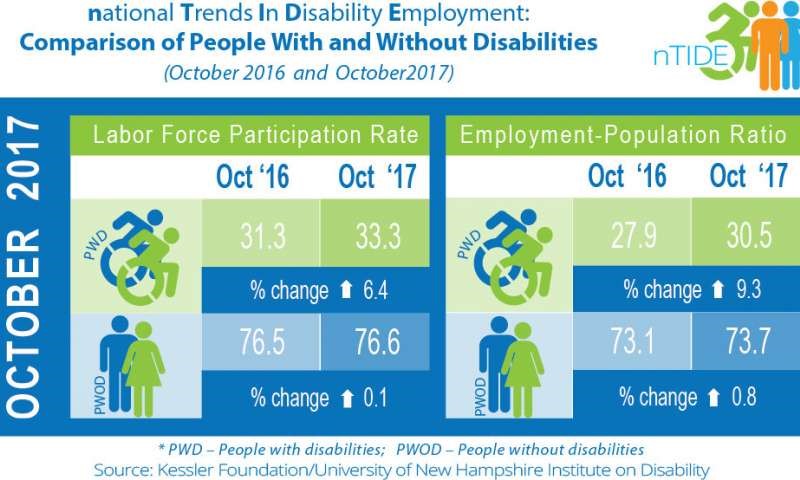
When we give training on the ADA, we encourage Title II and III entities to consider hiring qualified persons with disabilities. Cornell University’s website on Disability Statistics provides one of the best statistical data on unemployment. Unfortunately for people with disabilities, unemployment is higher. The unemployment rate (not working but looking for work) for people with disabilities in 2017 is 7.4% (1). The unemployment rate for people with hearing disabilities in 2017 is 8.5% (2). The unemployment rate for people with visual disabilities in 2017 is 8.7% (3). The unemployment rate for people with cognitive disabilities in 2017 is 8.0% (4). In comparison, the general unemployment rate in 2017 is 4.36%.
(1) 2017 Employment rates for people with disabilities. An estimated 7.4 % of persons with a disability were not working but looking for work. In other words, there were 913,500 out of 12,319,300 persons with a disability who were not working but were looking for work in 2014. The estimates above are from a sample of 122,966 persons who participated in the 2014 American Community Survey (ACS).
(2) 2017 Employment rates for people with hearing disabilities. An estimated 8.5% of persons with a hearing disability were not working but were looking for work. In other words, there were 204,400 out of 1,943,100 persons with a hearing disability who were not working but were looking for work in 2017. The estimates above are from a sample of 17,829 persons who participated in the 2017 American Community Survey (ACS).
(3) 2017 Employment rates for people with visual disabilities. An estimated 8.7% of persons with a visual disability were not working but looking for work. In other words, there were 180,400 out of 2,071,200 persons with a visual disability who were not working but were looking for work in 2017. The estimates above are from a sample of 19,362 persons who participated in the 2017 American Community Survey (ACS).
(4) 2017 Employment rates for people with cognitive disabilities. An estimated 8.0% of persons with a visual disability who were not working but looking for work. In other words, there were 478,600 out of 5,954,400 persons with a cognitive disability were not working but were looking for work in 2017. The estimates above are from a sample of 19,362 persons who participated in the 2017 American Community Survey (ACS).
If you have any questions on the ADA Effective Communication requirement, the rights of people with disabilities in interacting with their local and state government programs, or about my work, please don’t hesitate to reach out!
